I’ve been scratching my brain at this for a few days and I am not getting anywhere so I need some assistance.
I have an OV2500 install with a few switches and APs. Everything is working fine. All devices are properly discovered, and all are showing as UP.
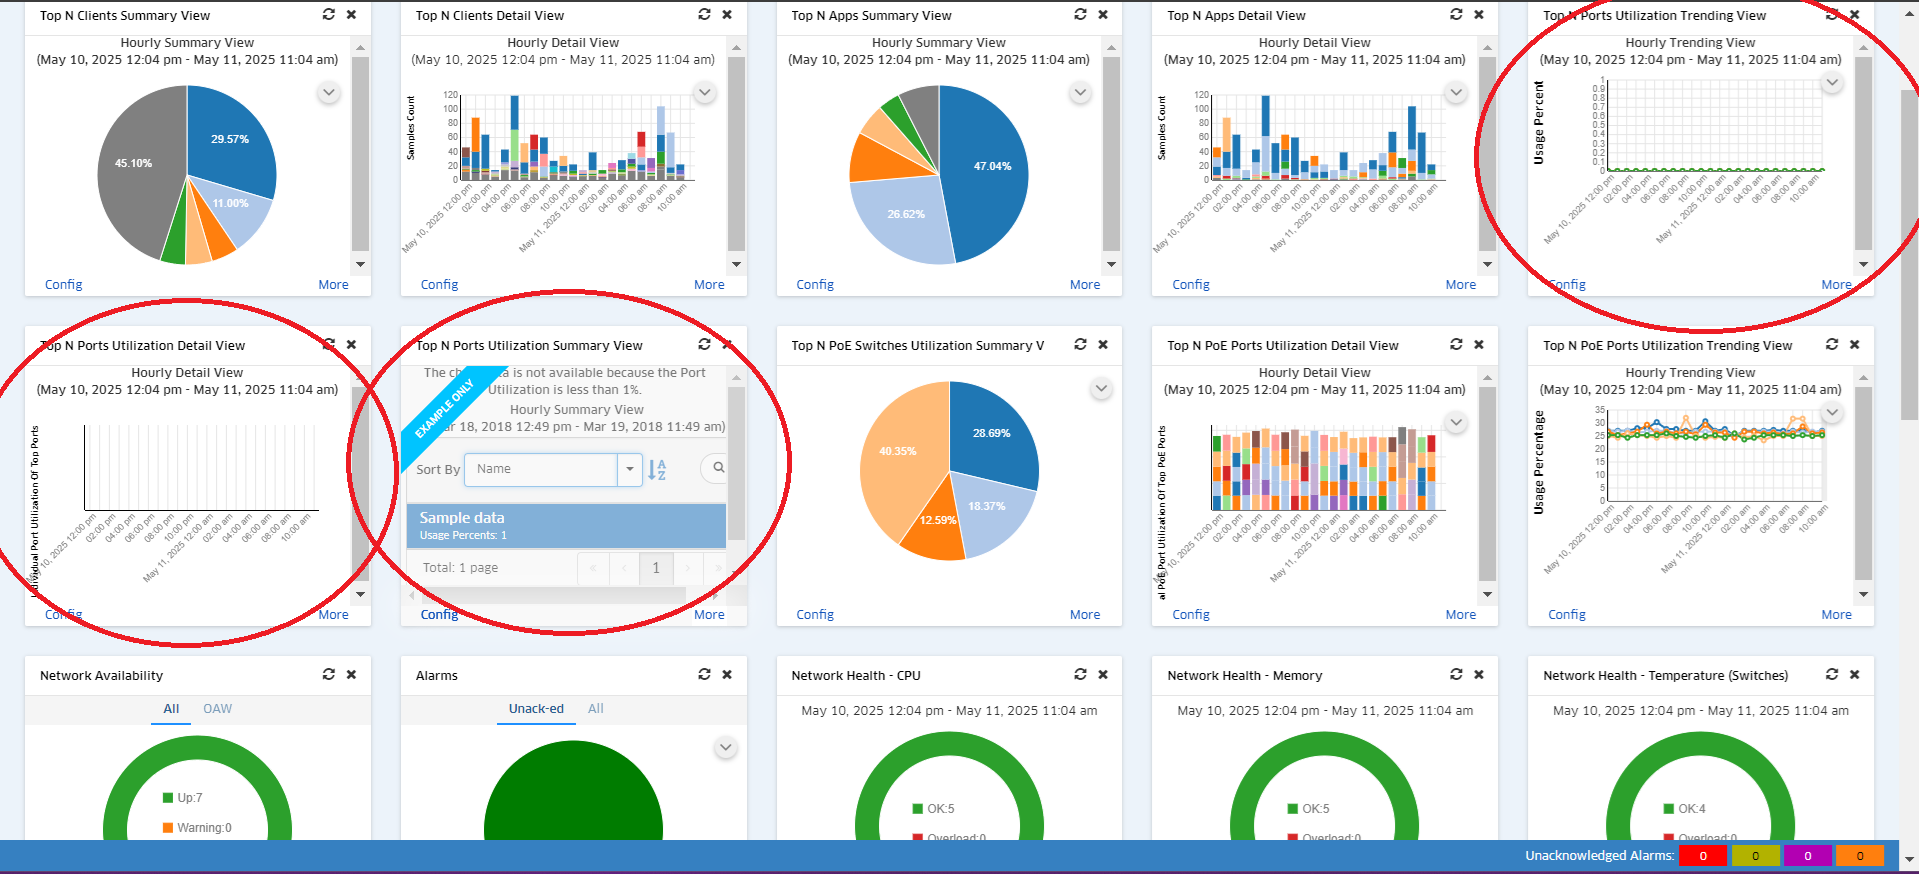
For some reason, both in the main widget dashboard and in the analytics reports sections, I cannot get any data for Port Utilization. All others work fine:
Top N Clients
Top N PoE Ports
Top N Applications
Network Health
Network Availability
Alarms
These all work perfectly, EXCEPT “Top N Ports”…
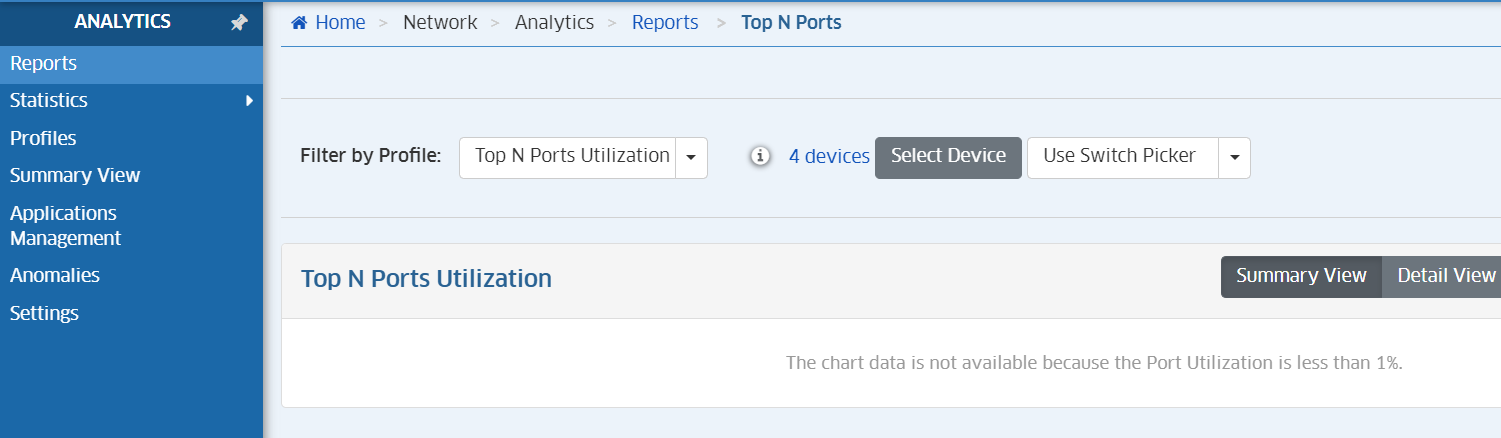
Within analytics, I’ve created a profile, I’ve added the switches and ports I need into it, and when I run a report for that profile, I get:
The chart data is not available because the Port Utilization is less than 1%.
When I use PRTG instead I can get my information without any issues so I’ assuming this is a OV misconfig rather than an SNMP one, but still, this is my config:
aaa authentication snmp local
user OV2500 password xxxxxxxxxx read-write all sha+aes
snmp security privacy all
snmp station 192.168.41.25 162 OV2500 v3 enable
snmp authentication-trap enable
sflow receiver 1 name sflow-ov2500 address 192.168.41.25 udp-port 6343 packet-size 1400 version 5 timeout 0
sflow sampler 1 port 1/1/1-52 receiver 1 rate 256 sample-hdr-size 128
sflow poller 1 port 1/1/1-52 receiver 1 interval 60
So, does anyone has any idea of what might be happening?
I’ve tried with SNMP v2 and v3, I’m also trying with 3 different models (2260 2360 6360) and all switches and OV are on the latest version. Any ideas?
This is what I’m seeing: